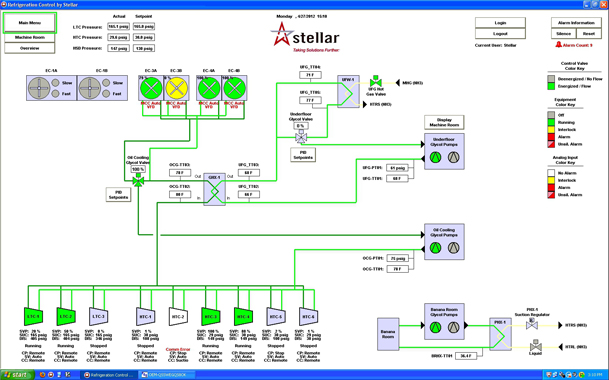
Your team relies on HMI screens to monitor real-time performance of your refrigeration control systems. But if your dashboards are not presenting that information in a clear, usable format, you’re not getting a clear picture. Your HMI should present performance metrics in a format that’s customized for your system to allow your team to effectively diagnose, analyze and manage your systems.
Your HMI screens should include an overview of the entire plant in addition to a single view of the machine room. Each piece of equipment can be animated and color-coded to show operational status, capacity, pressures, communication errors and other functions. Alarms and other critical issues are easily recognizable with pop-ups and red animation.
To get the most out of your HMI:
- data should be presented on one or more well-organized overview screens, which are useful for operation, training, troubleshooting and diagnosis
- ensure that your provider creates a graphical interface of your entire system with data displayed in a process flow layout as a functional schematic
- historical data should be presented as graphs in order to quickly and easily identify trends, which is especially useful in forensic analysis of alarms, system shutdowns and other problems
- equipment and data should be color-coded and animated for the most efficient monitoring.
Having a bird’s eye view of your entire system is crucial to monitoring equipment capacity, obtaining historical trends and gathering data to maximize efficiency.
An efficient, custom-designed HMI application has the added benefit of allowing operators to operate, monitor and maintain your refrigeration system from a single room, without the need to constantly walk to or through the plant. This equates to efficiency in both staffing and response. Operators can also log-in and monitor the system from remote locations if necessary and view the current status of the plant.


